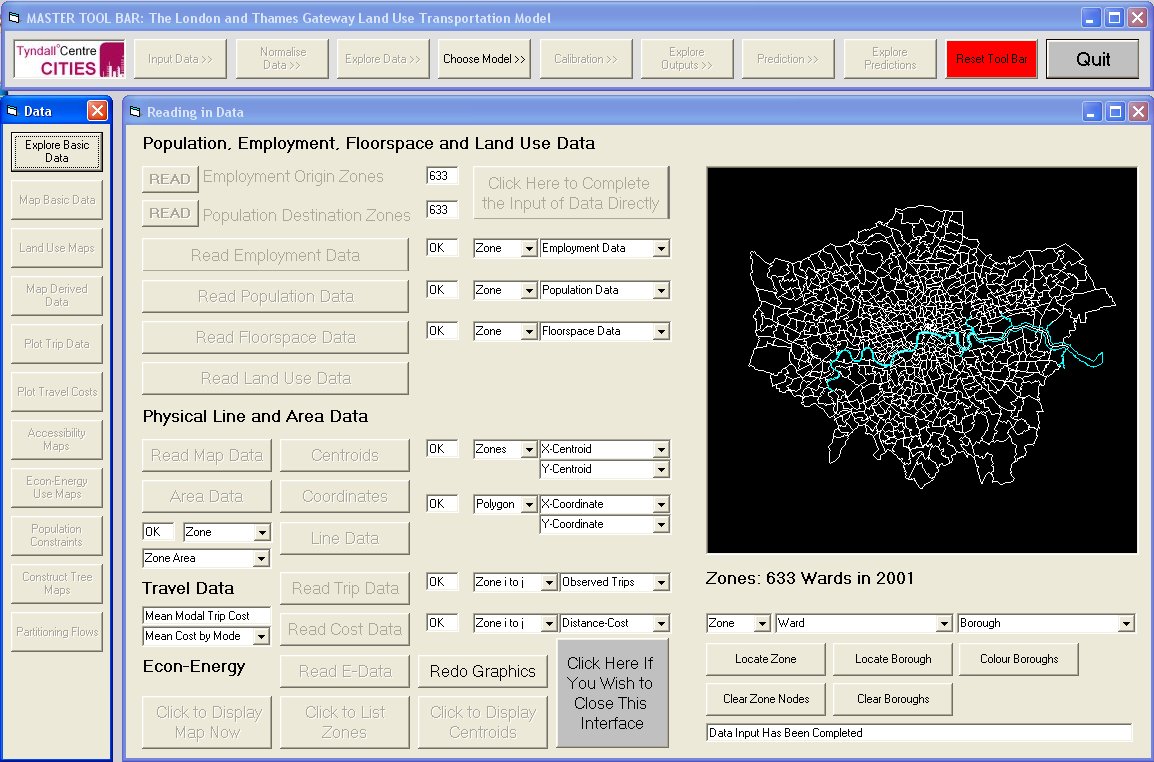
 Figure 9.1: Windows Comprising the Basic Interactive Model Template
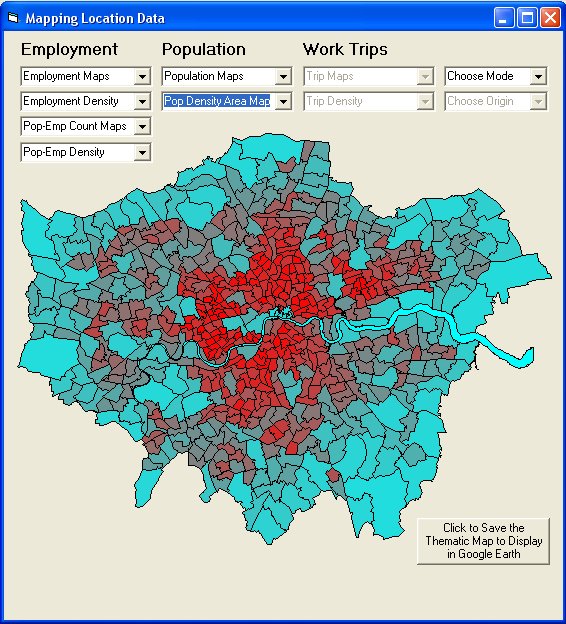
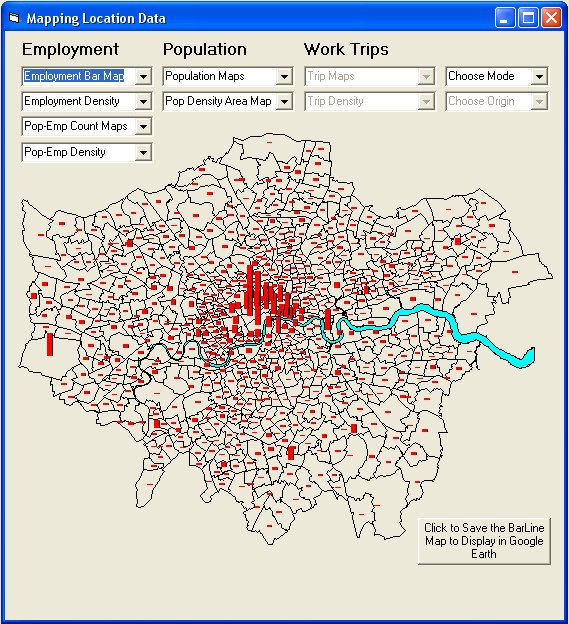
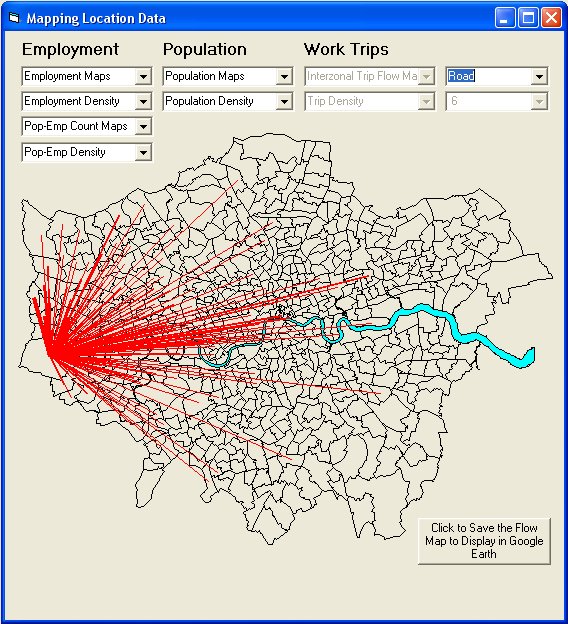
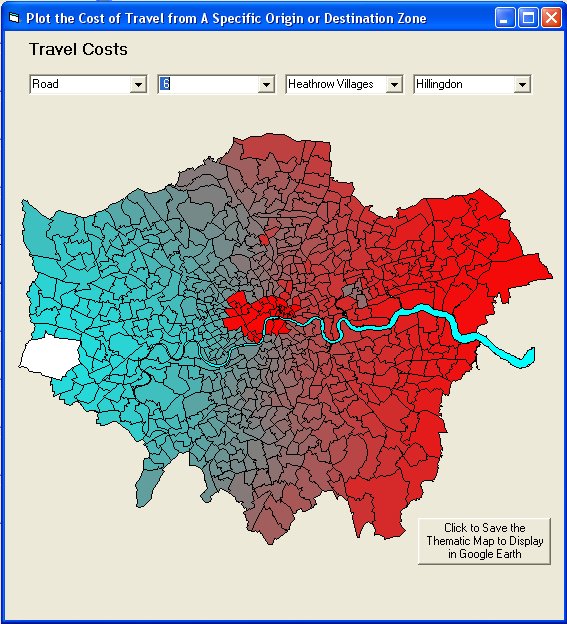
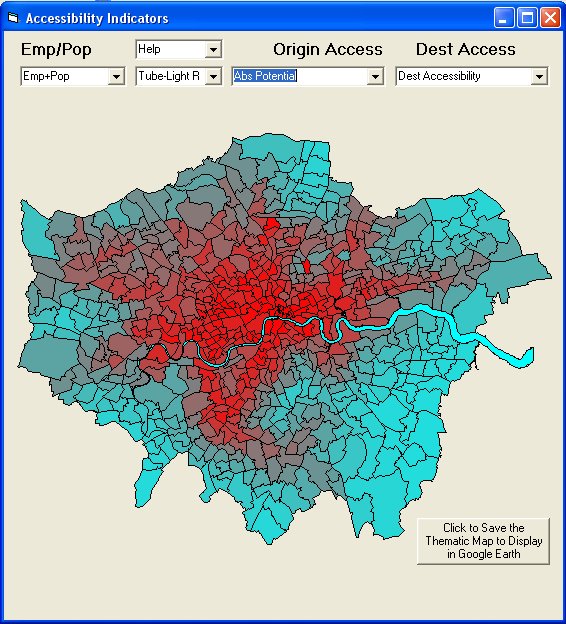
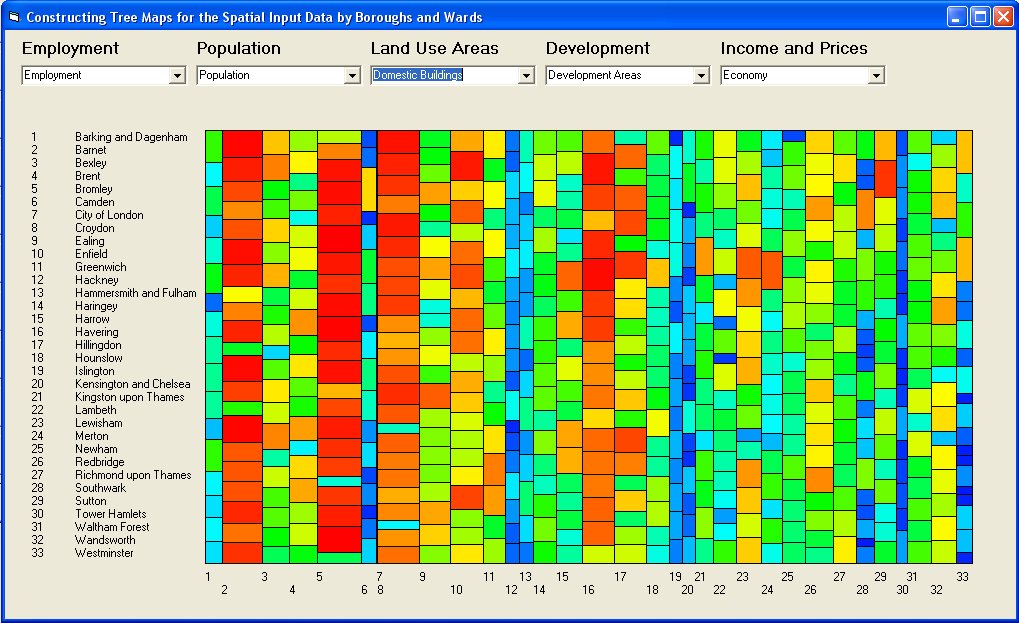
Figure 9.2: Small Multiples of Graphic Output from Exploration of the Model Data
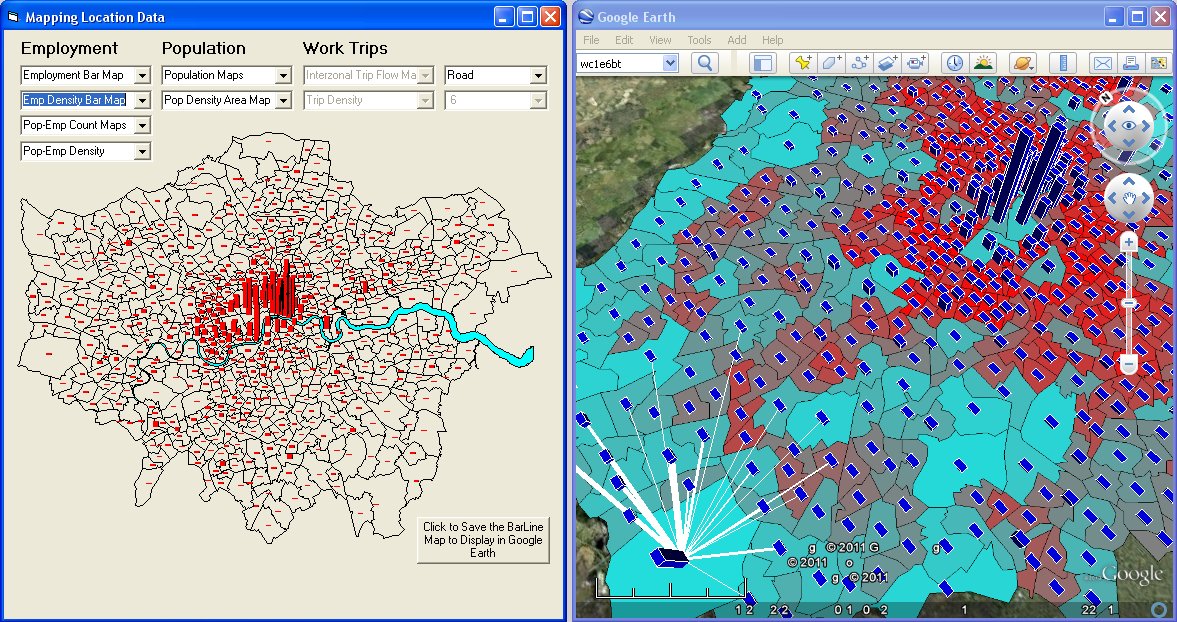 Figure 9.3: Visualizing Thematic Map Layers, Flows, and Histograms Using Google Earth as an External Viewer Linked to the Desktop Interface
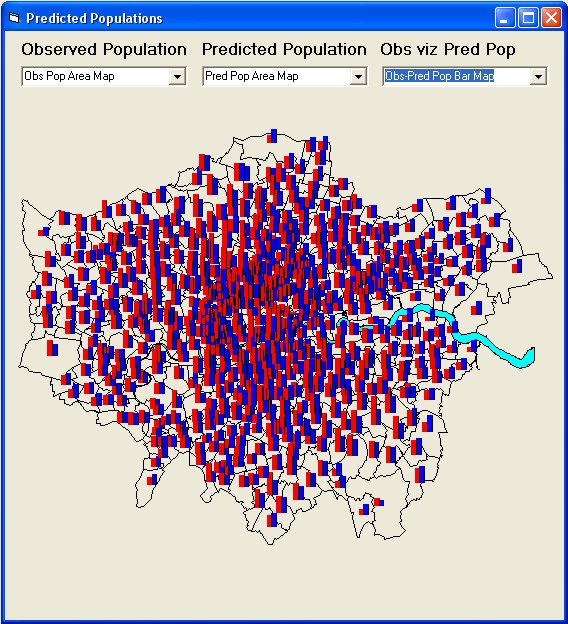
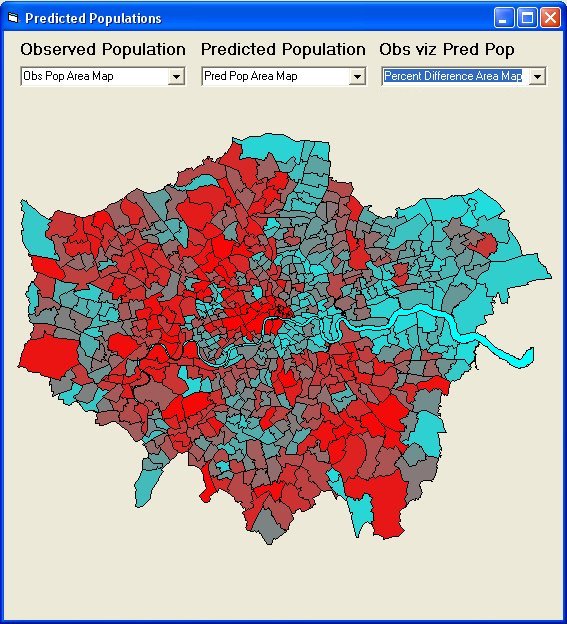
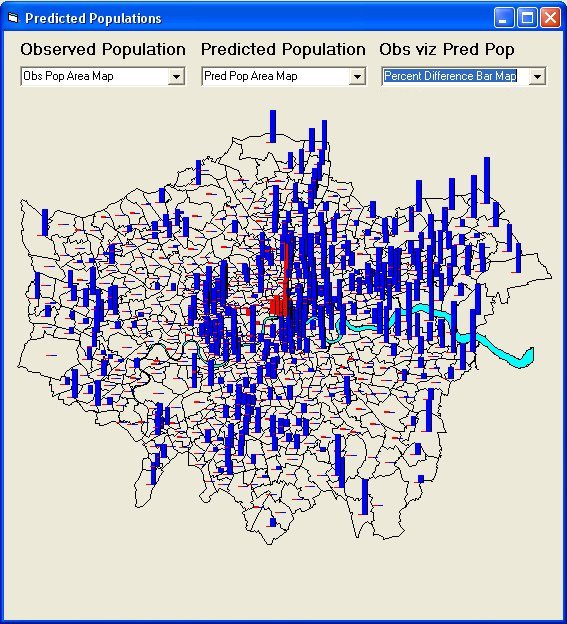
Figure 9.4: Predictions of Residential Population from the Model
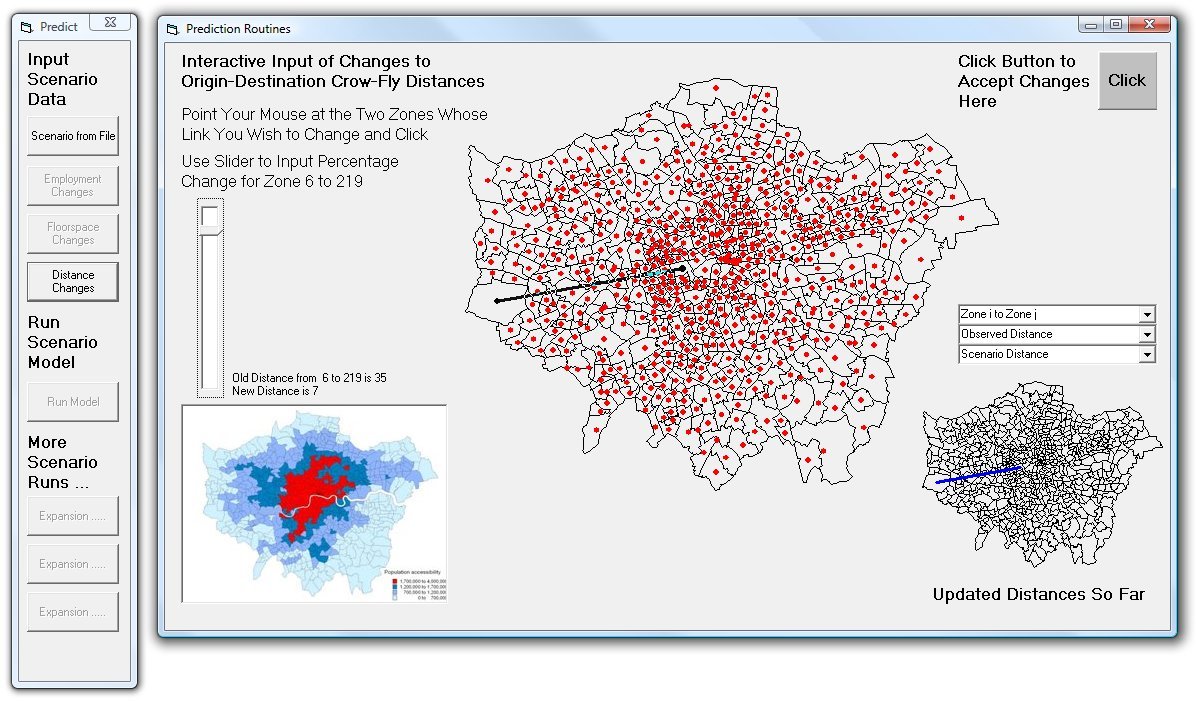 Figure 9.5: Building Scenarios on-the-Fly: Inputting a New Heavy Rail Line from the Western Airport at Heathrow to the West End of the CBD
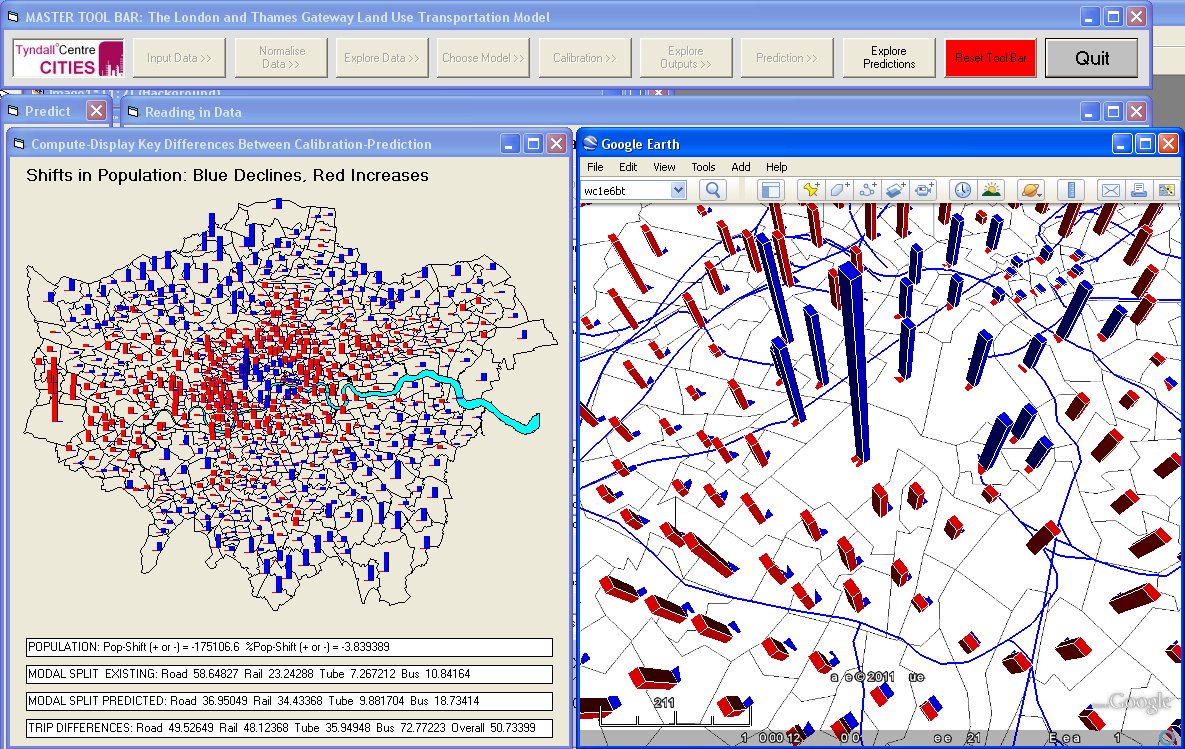 Figure 9.6: The Impact of a Doubling of Road Travel Costs for Private Car on Location
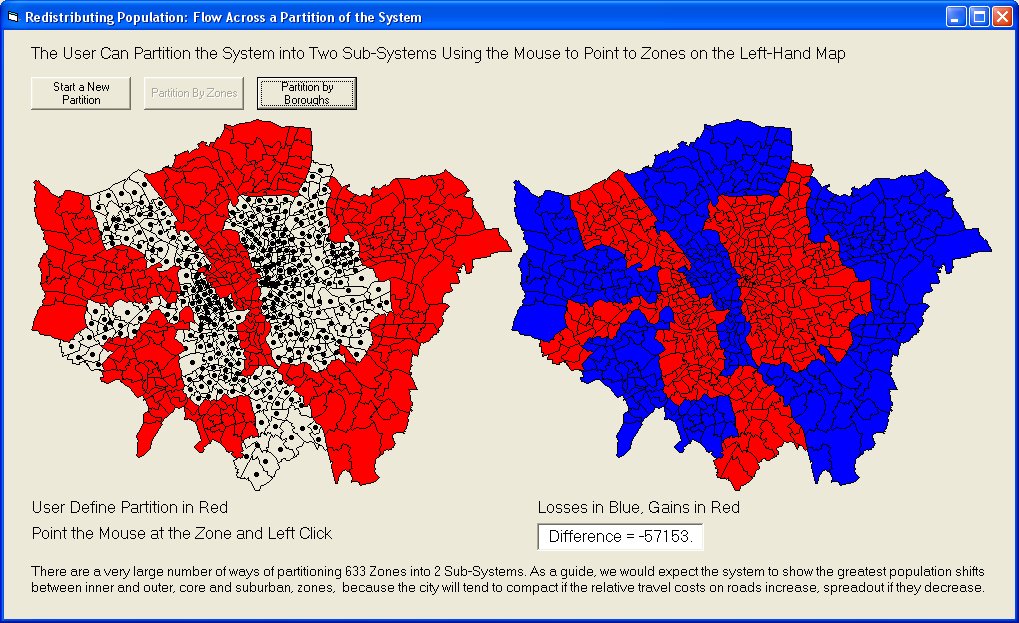 Figure 9.7: A Non-Contiguous Partition of the System Leading to Population Relocation
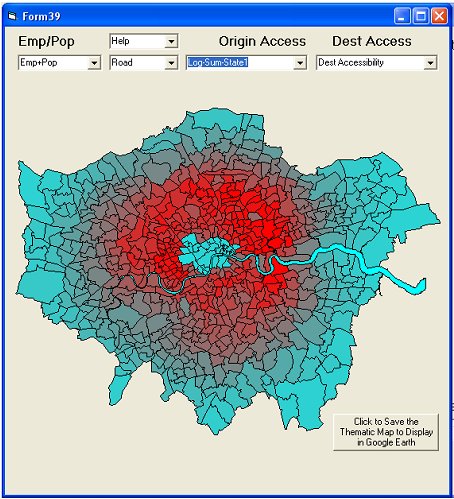
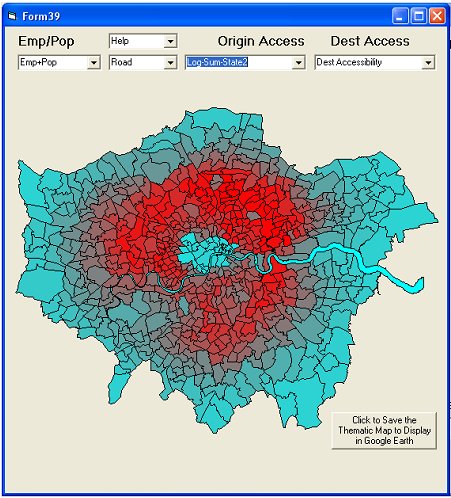
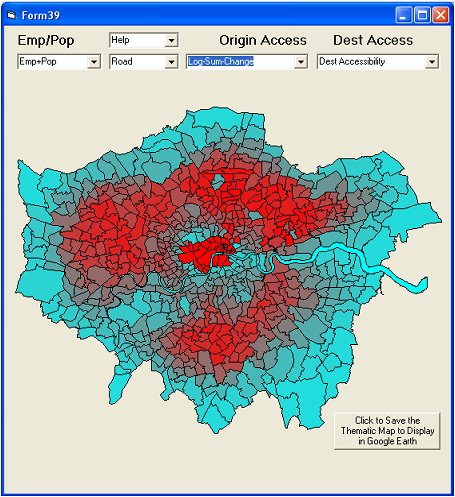
Figure 9.8: Before (a), After (b) Accessibility by Road and Their Ratio(c)